SHARE
Share on Facebook
Share on Twitter
Share on Linkedin
UCLA Equity, Diversity and Inclusion Homepage
Faculty Dashboards
General Campus Faculty Demographics
The General Campus Faculty Demographics Dashboard provides 5 years of data on the gender and racial/ethnic composition of UCLA faculty (Senate and non-Senate). Users have the option to filter the data by School/Division, Department, Academic Series, and Title.

Staff Dashboards
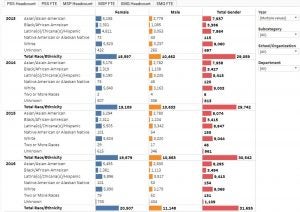
Non-Academic Staff Demographics
The Non-Academic Staff Demographics Dashboard provides 10 years of data on the gender and racial/ethnic composition of non-academic staff at UCLA. Data are presented as headcounts and FTE (full-time equivalents) counts. Users have the option to filter by Year, Personnel Subcategory, School/Organizational Unit, and Department.
Student Dashboards
Student Enrollments
Student Enrollments charts and data tables reflect the declared majors of enrolled students at the end of the third week of a term. Enrollments are reported as fall term snapshots and three-quarter averages (averaged across fall, winter, and spring quarters of an academic year).

Undergraduate Admissions
Undergraduate Admissions charts and data tables provide information on freshman and transfer applicants, admits, and enrollees.

Leadership Dashboards
Leadership Demographics
The Leadership Demographics Dashboard provides 9 years of data on the gender and racial/ethnic composition of UCLA Department Chairs, Deans, and Senior Administrators.

Student Dashboards
Student Enrollments
Student Enrollments charts and data tables reflect the declared majors of enrolled students at the end of the third week of a term. Enrollments are reported as fall term snapshots and three-quarter averages (averaged across fall, winter, and spring quarters of an academic year).
Undergraduate Admissions
Undergraduate Admissions charts and data tables provide information on freshman and transfer applicants, admits, and enrollees.
Leadership Dashboards
Leadership Demographics
The Leadership Demographics Dashboard provides 11 years of data on the gender and racial/ethnic composition of UCLA Department Chairs, Deans, and Senior Administrators.

Staff Dashboards
Non-Academic Staff Demographics
The Non-Academic Staff Demographics Dashboard provides 10 years of data on the gender and racial/ethnic composition of non-academic staff at UCLA. Data are presented as headcounts and FTE (full-time equivalents) counts. Users have the option to filter by Year, Personnel Subcategory, School/Organizational Unit, and Department.
Faculty Dashboards
General Campus Faculty Demographics
The General Campus Faculty Demographics Dashboard provides 5 years of data on the gender and racial/ethnic composition of UCLA faculty (Senate and non-Senate). Users have the option to filter the data by School/Division, Department, Academic Series, and Title.