Introduction
Welcome to the Office of Equity, Diversity and Inclusion’s Program Review page. Here you will find information that can be incorporated into your review process to monitor progress towards a more equitable, diverse, and inclusive program.
Note that these dashboards are only to be used for program review purposes.
OEDI Program Review Data Dashboards
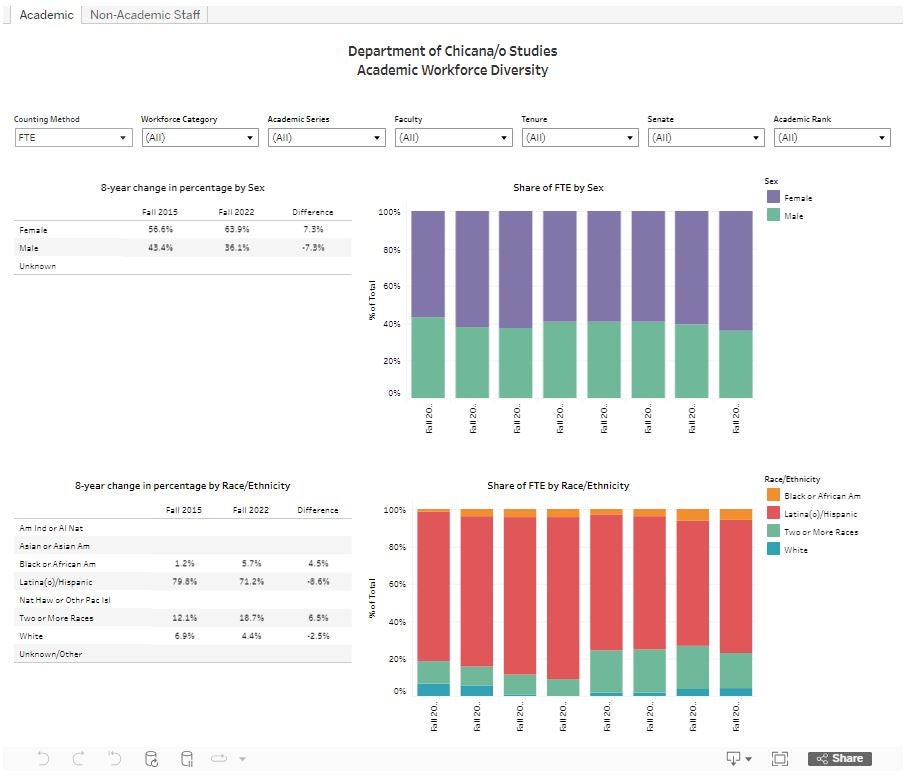
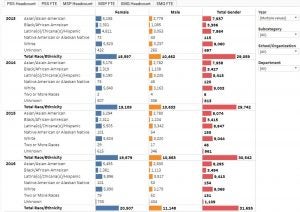
Chicana/o Studies Workforce Diversity – provides 8 years of data on self-identified sex and race/ethnicity of academic and non-academic employees in your program.
To view campus-level statistics, see the Employee Workforce Diversity dashboard.
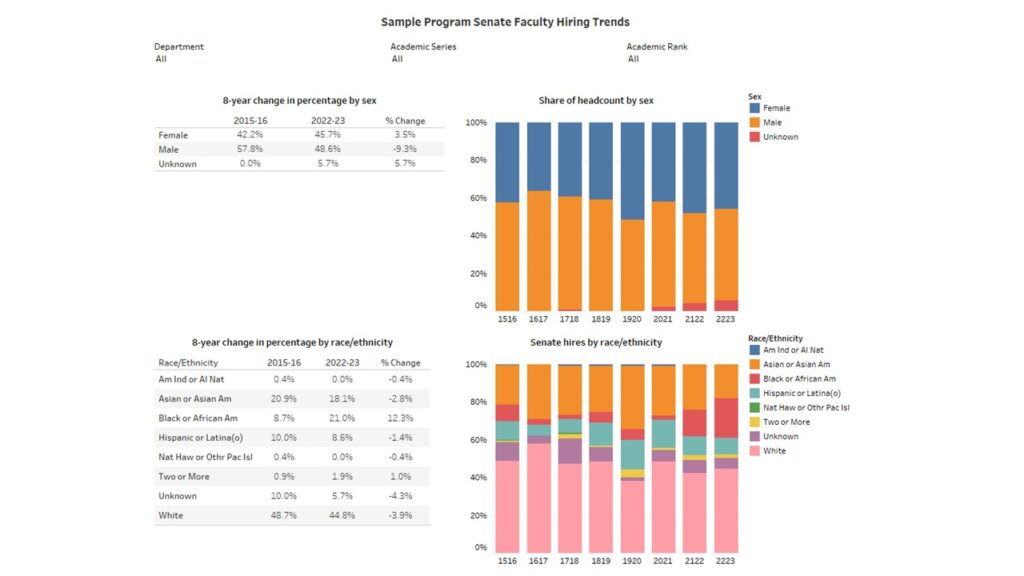
Chicana/o Studies Senate Faculty Hiring – provides 8 years of data on self-identified sex and race/ethnicity of Senate hires in your program.
Chicana/o Studies Senate Faculty Applicant Tracking – provides 8 years of data on self-identified sex and race/ethnicity of applicant, shortlist, offer, and hiring pools for Senate faculty positions in your program.
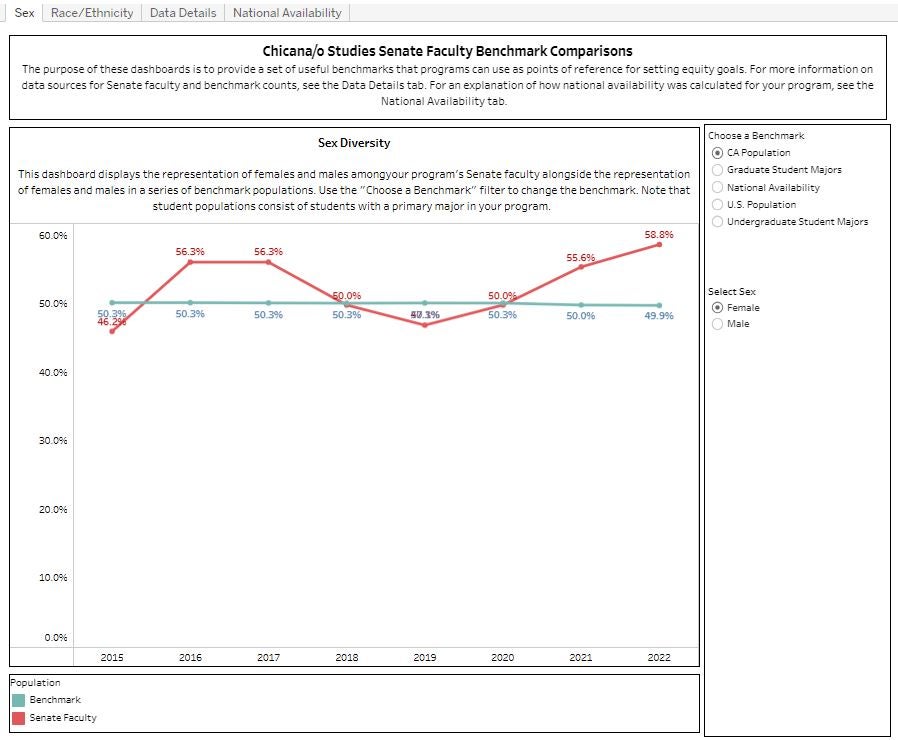
Chicana/o Studies Senate Faculty Diversity Benchmarking – provides 8 years of data on your program’s Senate faculty and a series of benchmarks, including undergraduate and graduate student populations, CA population, and US population.
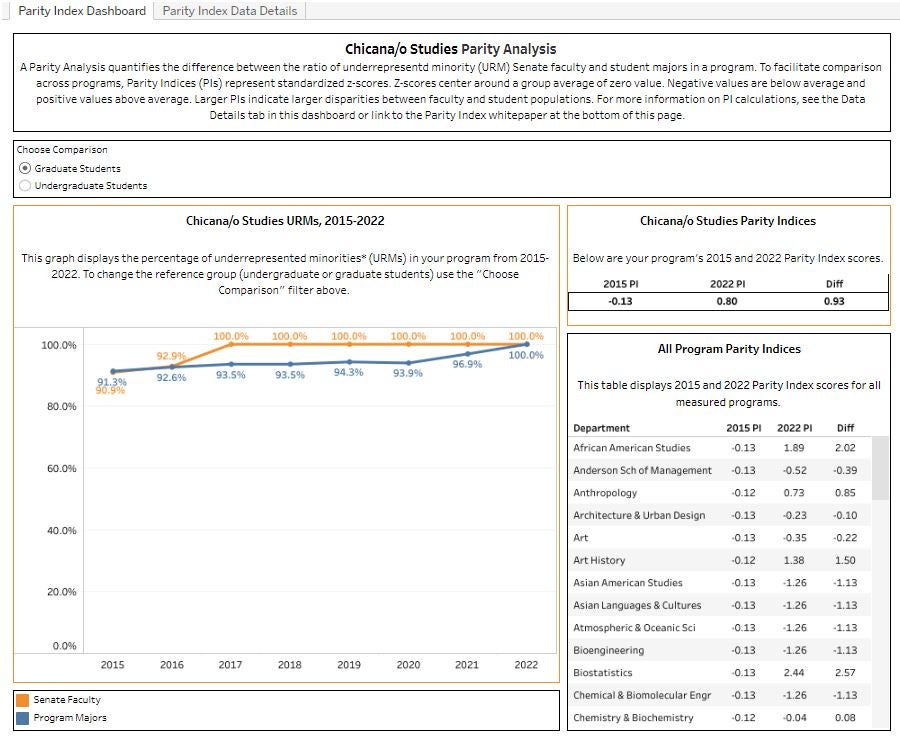
Chicana/o Studies Senate Faculty Parity Index -this index measures parity between your program’s URM Senate faculty and URM student majors.
Additional Resources
Glossary of Terms
Guidance Document